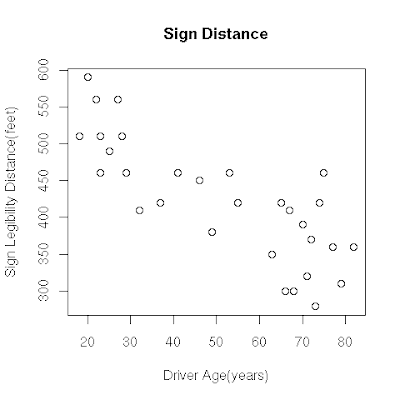
We try with simple scatterplot and then try to find its direction using R. So this is how our scatterplot looks when drawn using R.
# read the signdistance datafile that is included in here
# http://krishnadagli.blogspot.com/2008/07/learning-statistics-using-r-data-sets.html

> sigdist <- read.table("signdistance.txt", header=T, sep='\t')
# we want to create scatterplot in a png file, that is easy to upload.
> png("/tmp/signdist.png", quality=100, width=480)
> plot(sigdist, main="Sign Distance", xlab="Driver Age(years)", ylab="Sign Legibility Distance(feet)")
> dev.off()
So this how our scatterplot looks, we try to first find the direction of this plot.

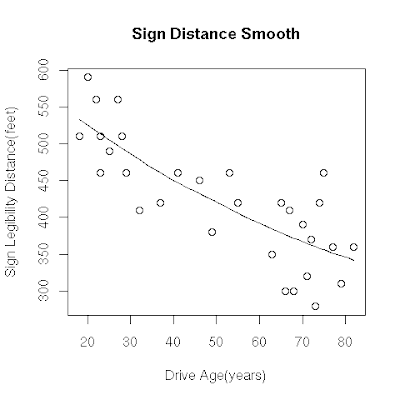
Find direction: (FIXME: Is this correct, what alternatives?): For finding direction of scatter plot we use one of R's function 'scatter.smooth'. The help page says that it plot and add a smooth curve computed by 'loess' to a scatter plot, and Wiki entry here mentions loess, or locally weighted scatterplot smoothing, as one of many "modern" modeling methods. Here is the R code to add a curve to our plot.
# we have already read data in sigdist object, lets use it.
# As we want to create and save the plot, we use png function.
>png("/tmp/sigdistsmooth.png", width=480, quality=100)
> scatter.smooth(sigdist, main="Sign Distance Smooth",
  xlab="Drive Age(years)", ylab="Sign Legibility Distance(feet)")
Here is how our scatterplot along with a curve looks.

We can see that the direction of the relationship is negative, which makes sense in context since as you get older your eyesight weakens, and in particular older drivers tend to be able to read signs only at lesser distances. (How do we get an arrow drawn over the scatterplot just like its shown in the course?)
Find form: The form of the relationship seems to be linear. Notice how the points tend to be scattered about the line. Although, as we mentioned earlier, it is problematic to assess the strength without a numerical measure, the relationship appears to be moderately strong, as the data is fairly tightly scattered about the line. Finally, all the data points seem to "obey" the pattern- there do not appear to be any outliers.
No comments:
Post a Comment