Note till now we were using "plot" or "scatter.smooth" function to create our scatter plot, but I have not found a nice and easy method of creating labeled scatterplot using these functions. So instead of these functions we will use another function from "car" package/library.
Recall the hot dog example from case I, in which 54 major hot dog brands were examined. In this study both the calorie content and the sodium level of each brand was recorded, as well as the type of hot dog: beef, poultry, and meat (mostly pork and beef, but up to 15% poultry meat). In this example we will explore the relationship between the sodium level and calorie content of hot dogs, and use the three different types of hot dogs to create a labeled scatterplot.
Lets do this with R using scatter.smooth function
# hotdog.txt is same as TA01_009.TXT
> hotdogdata <- read.table("hotdog.txt", sep="\t", header=T)
> attach(hotdogdata)
> names(hotdogdata)
[1] "HotDog"   "Calories" "Sodium"
# lets try firt with scatter.smooth function.
# As of version R version 2.6.2 (2008-02-08), 'quanlity' argument
# does not result in a warning but newer version does; pointed out by Gabriele Righetti.
> png("/tmp/hotdogtry1.png", quality=100, width=480)
> scatter.smooth(Sodium, Calories)
# We try added label to this plot using text command/function.
# Bug-Fix: Gabriele Righetti
> text(Sodium,Calories, HotDog)
> dev.off()
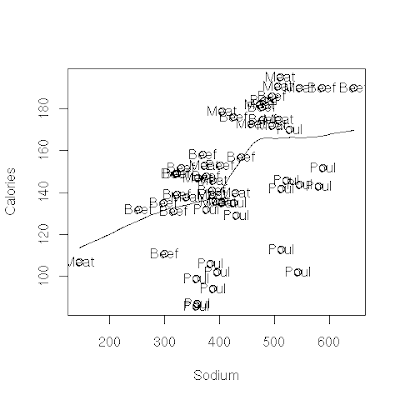
So here is our image, but this is not what we wanted. Here we have
tried to add text/label to this using "text" function but it has
become too ugly to look at. So now lets try creating a better labeled
scatter plot using "car" library.

Lets do this with R using "car" library
# we already have data that is attached. so let first load the
# library.
> library("car")
> png("/tmp/hotdogtry2.png", quality=100, width=480)
> scatterplot(Calories ~ Sodium | HotDog)
> dev.off()
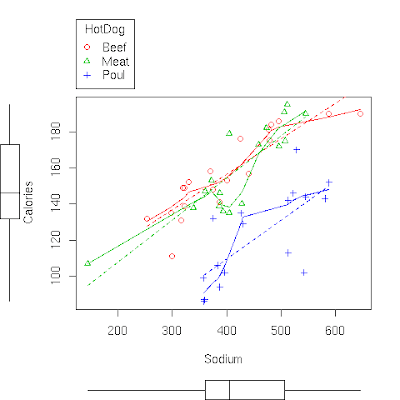
 So this is out second graph and this looks much better than our
earlier. Also there is an entire moive explaining concept of labeled
scatterplot at the
course website.
Lets Summarize:
- The relationship between two quantitative variables is visually displayed using the scatterplot, where each point represents an individual. We always plot the explanatory variable on the horizontal, X-axis, and the response variable on the vertical, Y-axis.
- When we explore a relationship using the scatterplot we should describe the overall pattern of the relationship and any deviations from that pattern. To describe the overall pattern consider the direction, form and strength of the relationship. Assessing the strength could be problematic.
- Adding labels to the scatterplot, indicating different groups or categories within the data, might help us get more insight about the relationship we are exploring.
No comments:
Post a Comment